How to use SWIM - get started
- Open model -latest version
(where similar how-to-use info in ⓘ -> popups )
- SWIM should work in any modern web browser
- Tested with Safari, Firefox, Chrome, Vivaldi
- Designed for a large screen (although still runs even on phone/tablet)
- Needs javascript (from summer 2021 or later) enabled
- Wait for the model code to load, followed by its data
- SWIM begins with an Oval layout.
- Cogs show progress and interactions, they rotate when calculating.
- Mini-plots should appear after a few seconds
- Later reloads should be faster if the browser caches some data
- (Check activity in console column far left - note draggable corner)
- The main cause-effect loop follows clockwise around the oval,
- starting (left) with drivers (demography, economy etc.) at the top,
- passing through energy, emissions, biogeochemistry
- to atmosphere and climate response.
- (but there are also cross-cutting controls / feedbacks)
- Select any Cog (click => yellow) to show, for each science- module
- Adjustable Parameters (centre-left)
- [ Documentation -coming soon ]
- Source Code (if code panel open)
- Cogs show more plots and parameters at higher complexity level
- (indicated by more cog teeth)
- As you move around the oval, nearby cogs, grouped by topic, shift to 'focus' level
- Double-click a cog to boost it to 'expert' level
- The menu (top-right) changes complexity level for all modules
(more useful in Columns layout)
- Click on mini-plots (left) to enlarge them
- Big-Plots open in a nearby panel (draggable), or corner,
depending on the chosen Layout (menu top-right).
- Zoom to enlarge plots using mouse-wheel or touch (spread/pinch).
- (X to close)
- Adjust plots
- Wheel/touch gestures also work for plot axes, to zoom for more detail
- Click on a big-plot for options (stacked, legend, labels, snapshot-year, etc.)
- Try adjusting model parameters (sliders, menus, checkboxes).
- First select a cog, then adjust its parameters
- The model should recalculate - some plots change (within seconds)
- You can also adjust *some* key parameters by dragging the arrow controls on plots
(especially the stabilisation targets, or various levels or years, on the same scale as plot axes )
Note: in the case of stabilise forcing, temperature, the model iterates, may not always find a solution
- Which modules recalculate depends on changed / needed interactions
(console has info about which ran in which order).
- You can reset all to default at the top-right.
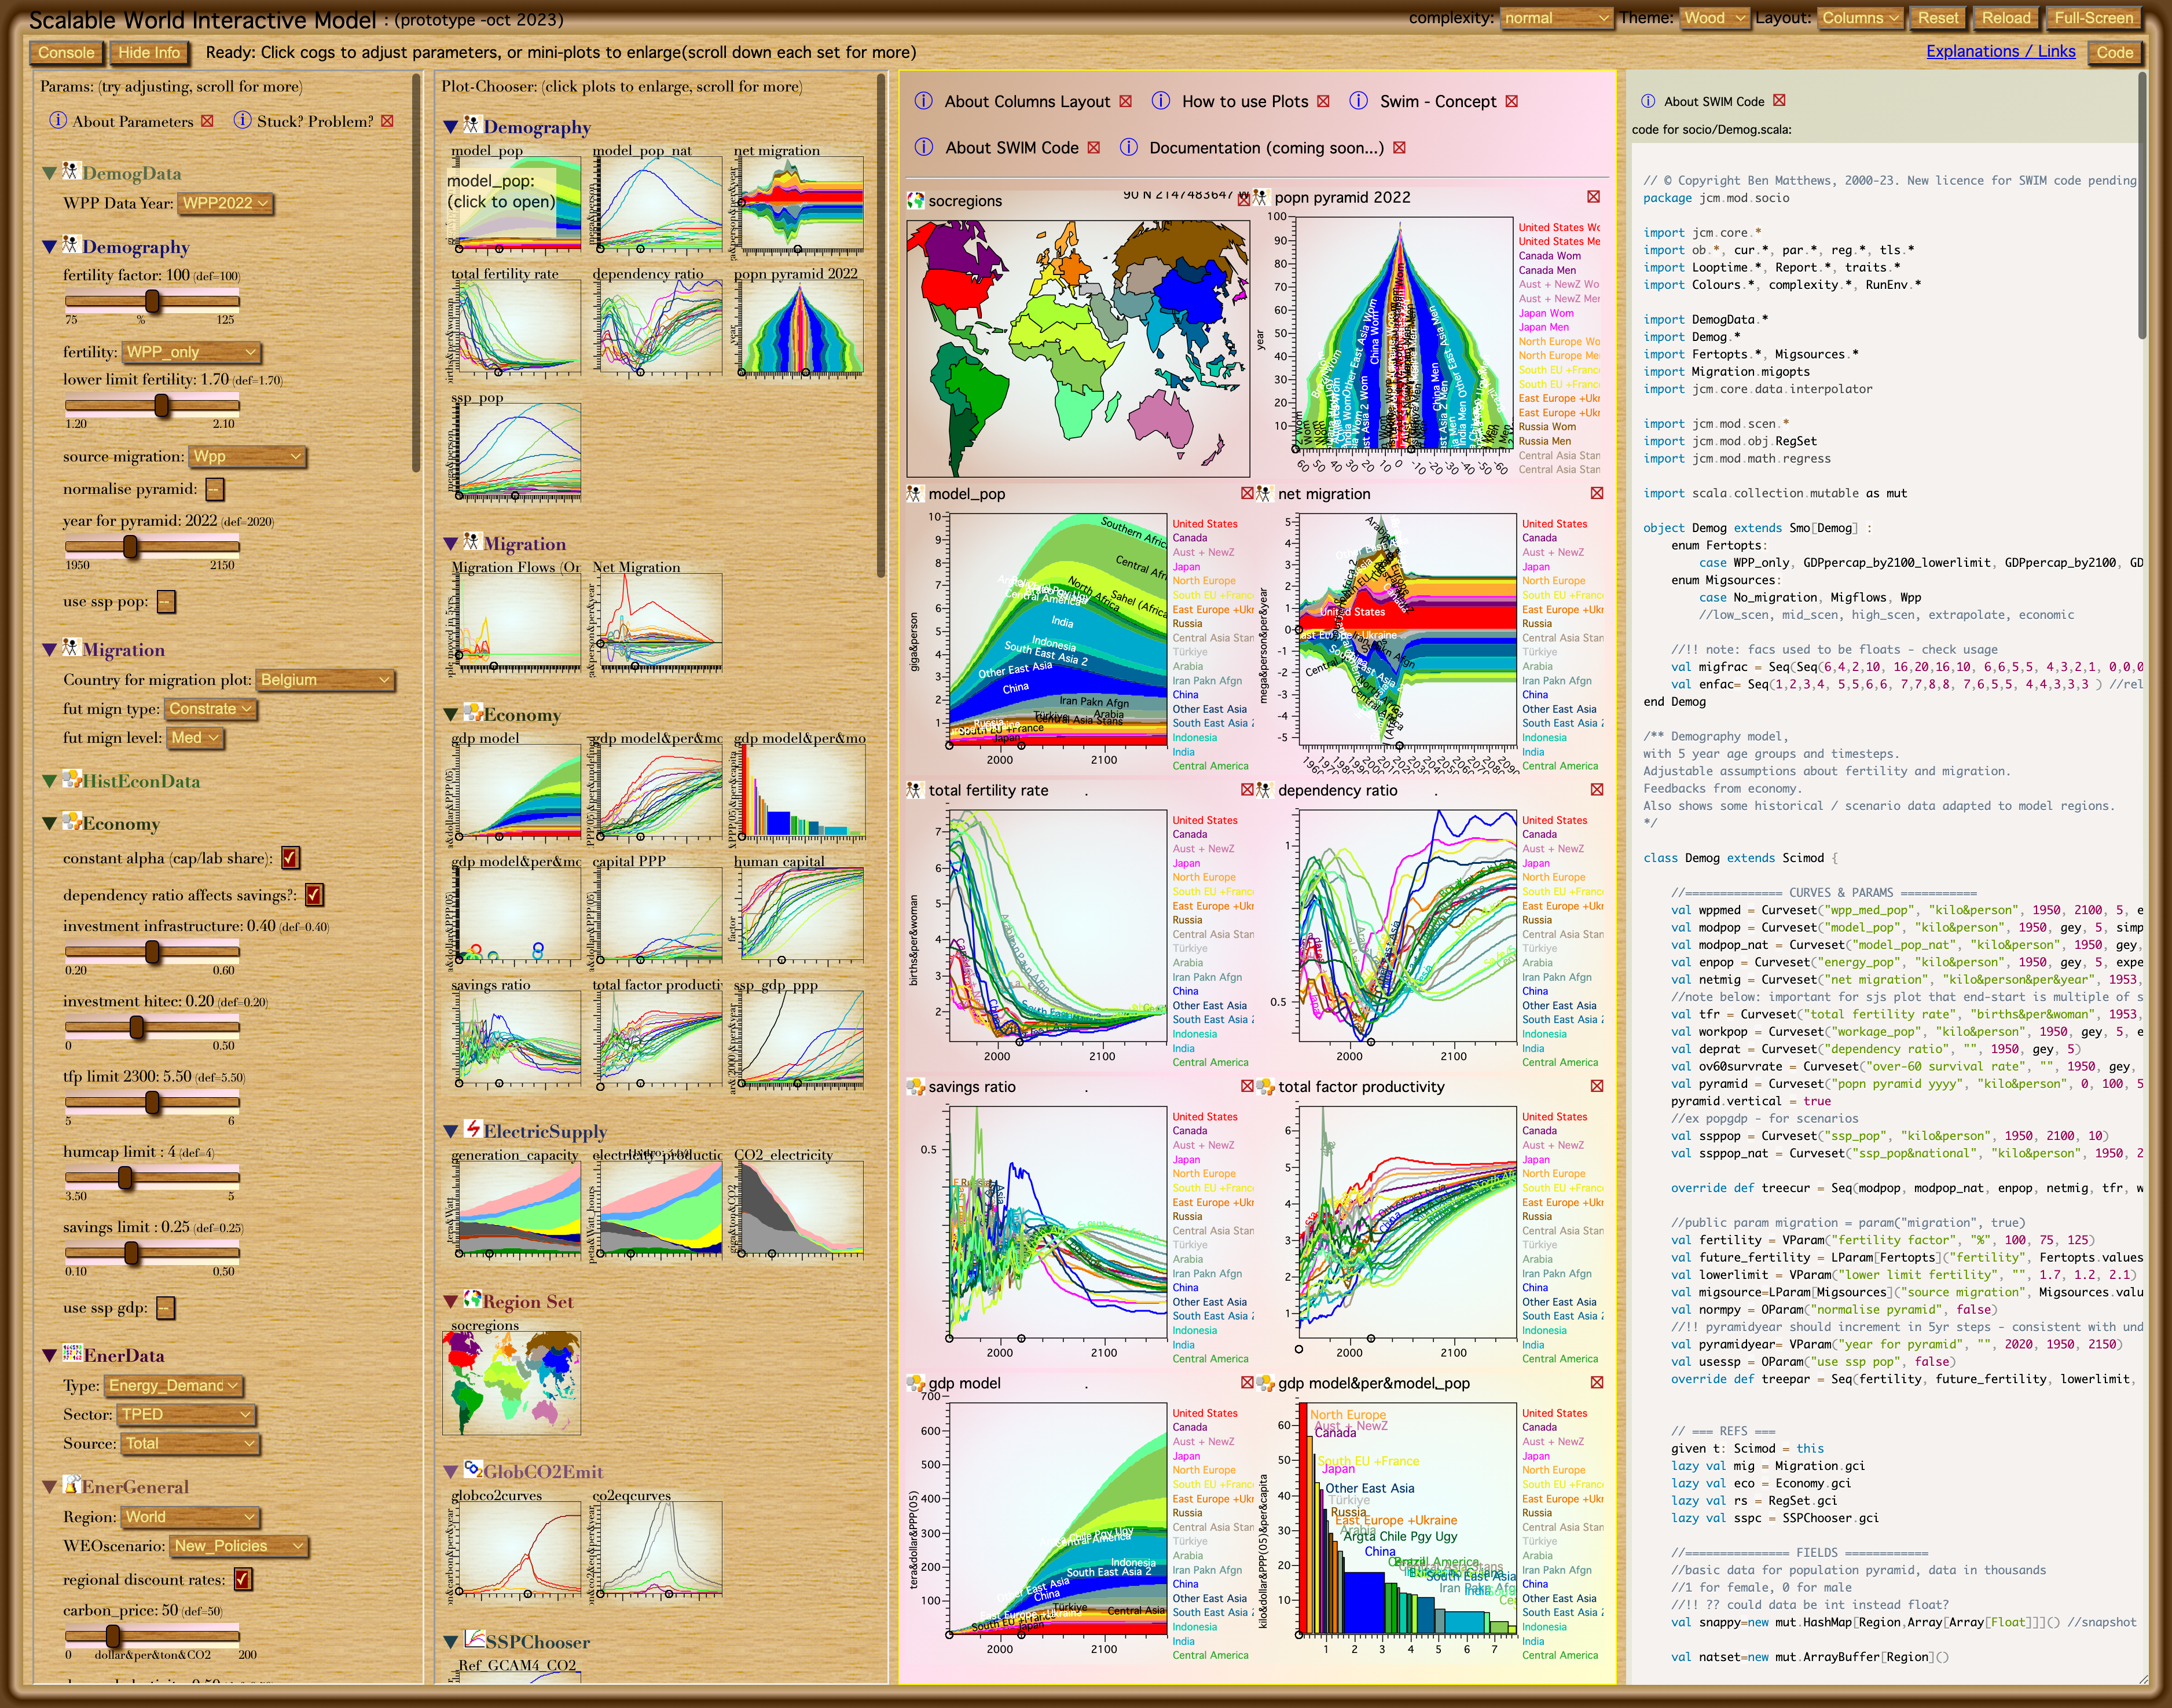
- Try the columns layout
- Layout menu at top right
- Columns layout is better for studying detail of one part of the system
- Scroll down the parallel columns of parameters or mini-plots (click to open)
- Click on titles to fold modules, also link to their code.
- You can also change the style-theme
- use menu at top-right (just swaps css)
- Change opening setup with url-query: (seeConfigure Setup)
|
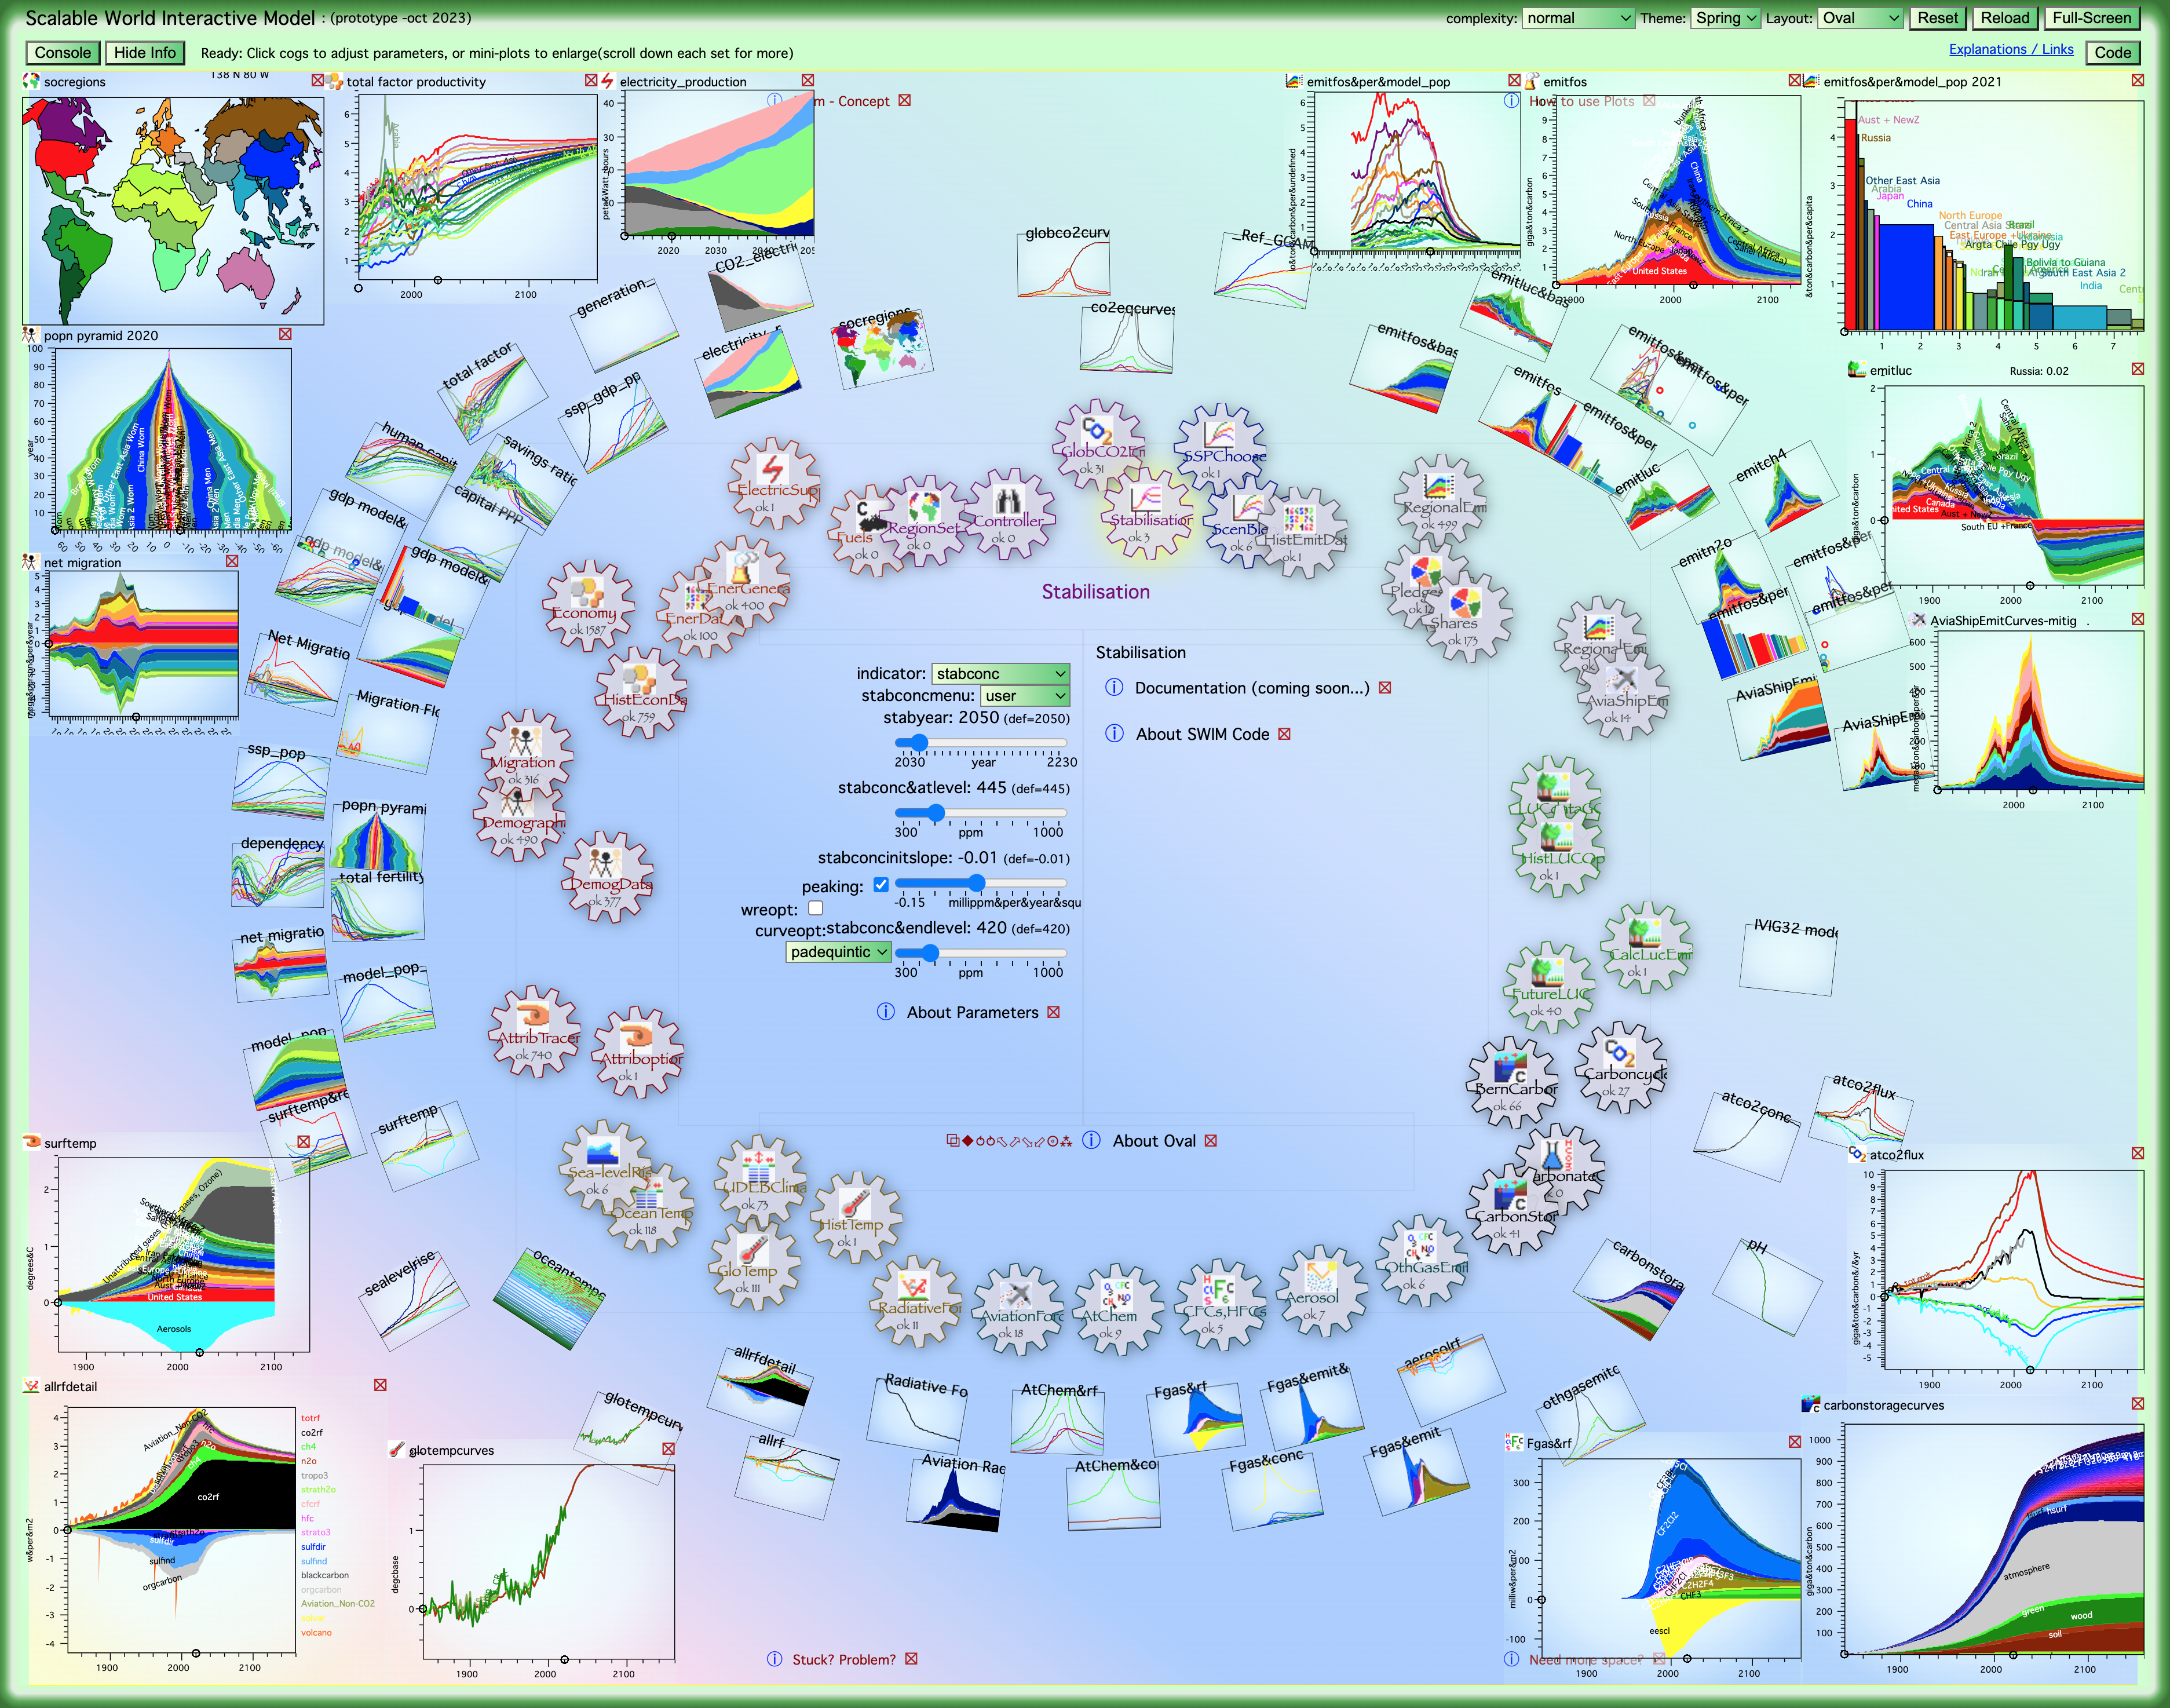
Above: Oval Layout - showing whole-system interactions. Plots in corners
Below: Columns Layout - to focus on detail - here socioeconomic end, code for demography shown
|